Redstone
Redstone is a portfolio analytics platform that scores stocks, ETFs, and user-built portfolios against Sharpe, Sortino, Calmar, and 20+ other risk metrics with daily-refreshed data.
About Redstone
Overview
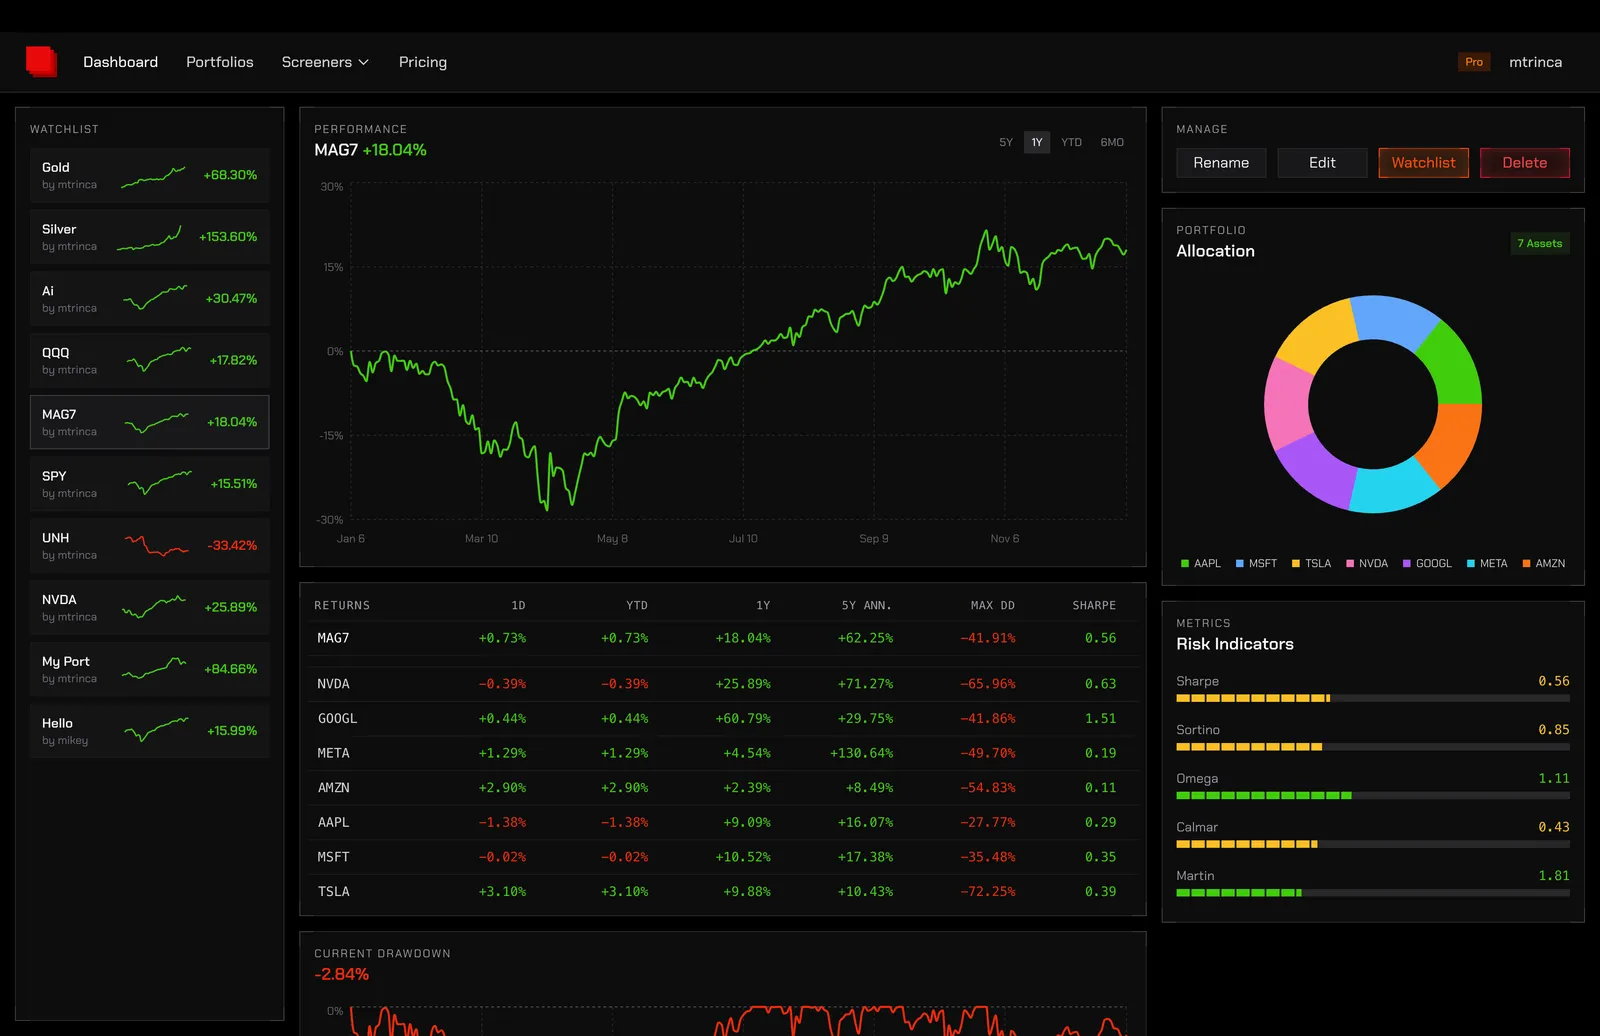
Redstone is a browser-based portfolio analytics workspace aimed at self-directed investors who want quantitative rigor without a Bloomberg terminal. The platform tracks 3,400+ securities and portfolios with five or more years of historical data, refreshed daily, and surfaces risk indicators including alpha, beta, Sharpe, Sortino, Omega, Calmar, and Martin ratios alongside returns, max drawdown, volatility, and dividend yield.
Core workflow
- Screen – filter the security universe by return, volatility, and yield.
- Rank – each ticker receives a 0–100 percentile score against peers across six dimensions.
- Compare – two tickers or portfolios placed side by side, with prebuilt ETF pairings such as VTI vs VOO and SPY vs QQQ.
- Track – watchlists and shared community portfolios consolidated into one dashboard.
Portfolios can be cloned, made public for community browsing, or kept private. An optimization engine runs a limited number of times per day depending on tier.
Pricing tiers
A free Starter plan covers 5 portfolios, 10 assets each, 3 daily optimizations, and 25 watchlist items with full chart and metric access. Plus at $15/month raises limits to 25 portfolios and 50 optimizations and unlocks private portfolios. Pro at $50/month removes portfolio, asset, and optimization caps and adds priority support. Annual pricing is not disclosed on the landing page.
Considerations
The tool is analytics-only; no brokerage connection or trade execution is described, and no mobile apps are listed. Performance figures shown are illustrative sample data.
Pros
- Exposes institutional-style risk metrics such as Omega, Calmar, and Martin ratios that most retail tools omit entirely.
- Percentile ranking system scores every ticker out of 100 against its peer group across return, drawdown, volatility, and yield dimensions.
- Free tier includes full access to charts, screeners, and every risk metric rather than gating analytics behind a paywall.
- Direct side-by-side comparison routes for popular ETF pairs eliminate manual setup work for common allocation questions.
- Community portfolio library lets users clone and inspect publicly shared strategies filtered by risk profile.
Cons
- Optimization runs are rate-limited even on paid tiers, which constrains iterative backtesting sessions.
- No brokerage integration or trade execution is described, so the platform operates as an analysis layer only.
- The $50/month Pro tier is a steep jump from Plus for features that are largely usage caps.